Privacy statement: Your privacy is very important to Us. Our company promises not to disclose your personal information to any external company with out your explicit permission.
Select Language
The generation of standing waves is caused by the superposition of two columns of oppositely propagating waves. This means that sound waves returning to their own waves during reflection can "interfere" with themselves. This interference is both constructive and destructive. This will seriously affect the peaks and troughs of the sound waves, which will cause the sound to become smaller or even disappear, or the sound intensity will double. This experiment will use the sensor on the DrDAQ to measure the intensity of the sound produced by the superposition of the emitted and reflected sound waves, giving a clear image of the standing wave.
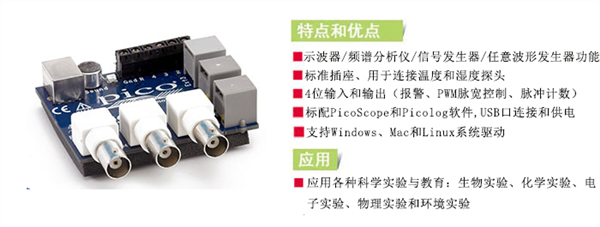
Required equipment: PC with PicoLog data recording software, a DrDAQ data logger, sound source with a frequency of about 1 kHz, 1 meter board (thickness 18swg, sheathed wire along its length), 24swg cable, for reflection Sonic board, 2 1.5 volt batteries and a switch.

Experimental setup: Connect 2 batteries and connect to the opposite ends of the wires mounted on the board to create a circuit diagram.

Connect DrDAQ to your PC and load the PicoLog software. Install the wire to the bottom of the DrDAQ (as shown) and connect the other end to the “ground” of the device.

It should be noted that the parallel port should be placed on the other end to run, so that when you move the DrDAQ down, your hand will not interfere with the sensor. Connect the 1m "flying" lead to the voltage input of the DrDAQ and the other end to the beginning of the thick line of the board. Next, place the DrDAQ on the board so that the wires on the board and the wires on the underside of the DrDAQ are perpendicular and in contact. This creates a potential divider.
The voltage read by DrDAQ will be proportional to the distance from the starting point of the cell. This measures the distance between the sensor and the sound source. Then place the DrDAQ on both ends and pay attention to the voltage at 0m and 1m from the sound source. (Because of the small resistance, this circuit can cause high current leakage to the battery, so the switch can only be closed when measuring voltage).
Finally place the sound source at the beginning of the track and place the reflector at the end of the track. Set the PicoLog software to record voltage and sound intensity and ensure that the Sample Read is set to Single. Recording 200 samples at 100ms intervals, we can get the full length of the 20 second trajectory.
Experiment: Place the DrDAQ at the beginning of the track and turn off the switch. Start recording the PicoLog and slowly move the DrDAQ along the track (use a parallel cable when moving to make sure the hand leaves the sensor). The speed of movement should be 15-20s/m (that is, the entire moving process time is 15s - 20s). If you finish the track 20 seconds ago, you still need to keep the DrDAQ online at the end until PicoLog completes the logging.
Discussion of problems and results
1. How does the graph change if the frequency of the sound source increases or decreases?
2. Can you determine the wavelength of the sound source?
3. Why is the intensity of Boeing lower?
4. Why is the node closest to the reflector more "quiet"?
5. What would the graphic look like without a reflector?
July 06, 2023
इस आपूर्तिकर्ता को ईमेल
July 06, 2023

Privacy statement: Your privacy is very important to Us. Our company promises not to disclose your personal information to any external company with out your explicit permission.

Fill in more information so that we can get in touch with you faster
Privacy statement: Your privacy is very important to Us. Our company promises not to disclose your personal information to any external company with out your explicit permission.